
We've just updated data exploring tables to provide more exploratory power right in Amberlo. Now you can explore a data set with quick groups, sorts, and filters—without exporting data to excel.
You can enable this data display in these basic Amberlo modules:
- Contacts;
- Matters;
- Bills;
- Planning;
- Activities (Timesheets and expenses);
- Contracts.
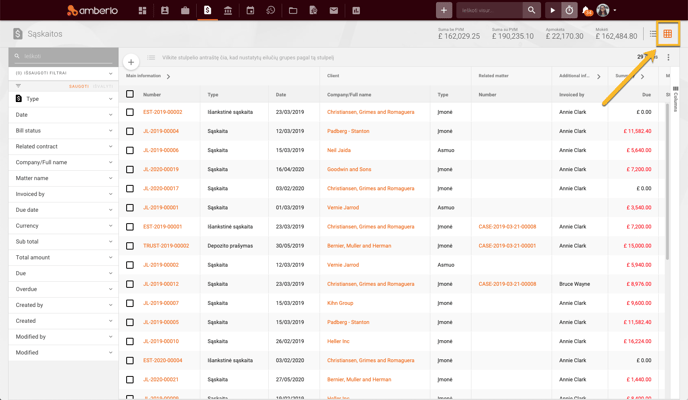
In order to get a table view, click the Table icon at the top right of each module to quickly narrow the data down.
Table Icon: ![]()
Structure and customize table layouts
Once you're viewing the table, you can customize the table layout, then filter and explore data in the table down to find specific data points.
Contents:
- How To Add a Column To Your Table Layout?
- How To Group Data in the Columns?
- How To Sort Data in a Column?
- How to Use a Pivot Mode to Create Custom Reports in Amberlo?
- Useful Tips
How To Add a Column To Your Table Layout?
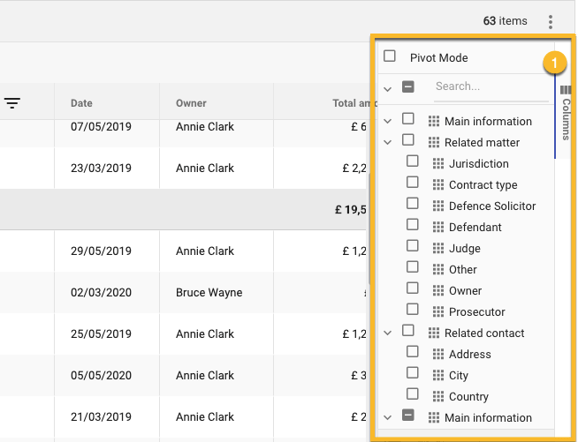
To get started building your table, open the Columns management module, which is on the right side of the Amberlo window (1).
To add a column to a table layout, simply mark the checkbox of the column that you want to see. Checking each column name will add its respective column to the table:
Note: Leaving an option unchecked will hide the associated columns from your table.
How To Group Data in the Columns?
Table view with a lot of content can sometimes feel overwhelming and even become difficult to read. Fortunately, Amberlo can organize data in groups, allowing you to easily show and hide different sections of your table.
To get started organizing your table, simply drag and drop a column name on the Rows shelf in your worksheet. Adding each column name will group respective column to the table:
Note: In order to easier navigate these wide tables, you can horizontally scroll across the entire table, to see all of your dimensions and measures.
How To Sort Data in a Column?
We’ve also made sorting more useful and intuitive, with the ability to sort the entire table by a discrete column value. Simply click on the column header to sort the entire table. In the below example, seeing all data sorted by highest to lowest values takes just a couple of seconds.
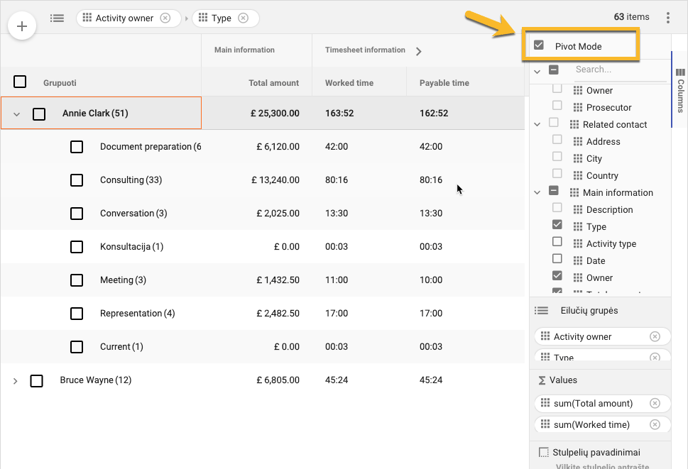
How to Use a Pivot Mode to Create Custom Reports in Amberlo?
If you are working with large data sets, you'll surely know that the Pivot table comes in really handy as a quick way to make an interactive summary from many records. Among other things, it can automatically sort and filter different subsets of data, count totals as well as calculate the average.
Another benefit of using Pivot tables is that you can set up and change the structure of your summary table simply by marking the checkbox of the source table's columns.
Enabling Pivot is very simple:
1. Mark the "Pivot Mode" checkbox in the Columns Management Tool;
2. Use the checkboxes to select the Columns you would like to see.
Note: The changes that you make in the PivotMode Column List are immediately reflected in your table.
Useful Tips
- How Do I Restore a Default Table View?
- How To Save Custome Filter in Amberlo?
- How To Export Report Data into Excel or CSV?
- How To Print Report Data in Amberlo?
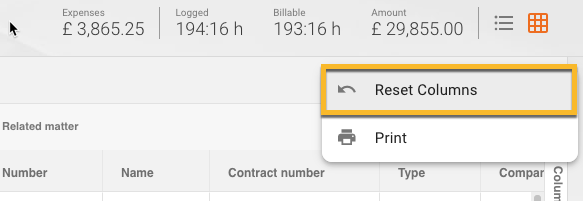
How Do I Restore a Default Table View?
If you need to restore a default table view:
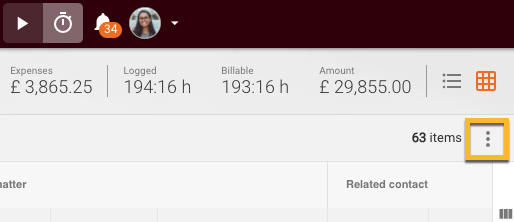
1. Click on the three dots on the right side of the window:

2. Select Reset Columns:
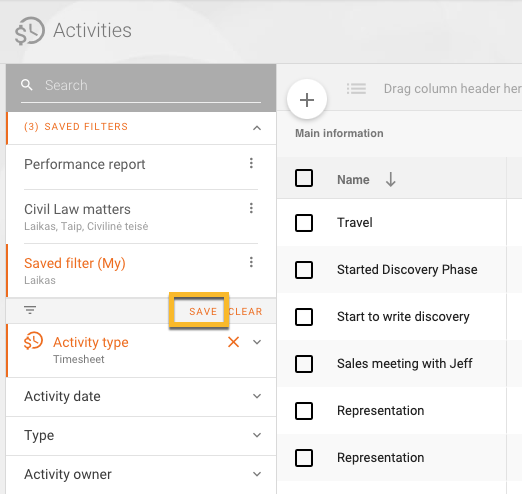
How To Save Custom Filter in Amberlo?
If you want to save the current table display with all settings you made as a Custom Filter that you can quickly apply in the future, you just need to:
1. Click on the Save button and enter a name for your new filter:
Once the filter is created, you can always find it in the Saved Filters section:
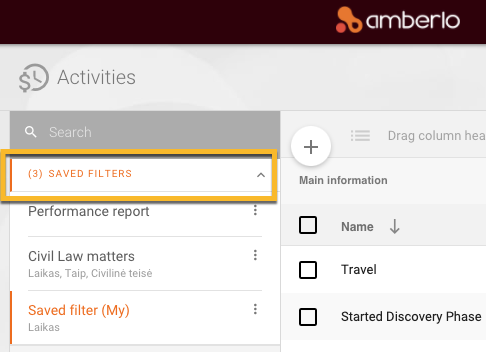
Now, the next time you want to use your report, just need to select the filter you want to use. This saves you time and prevents you from having to redo work when you run out your PivotTable reports.
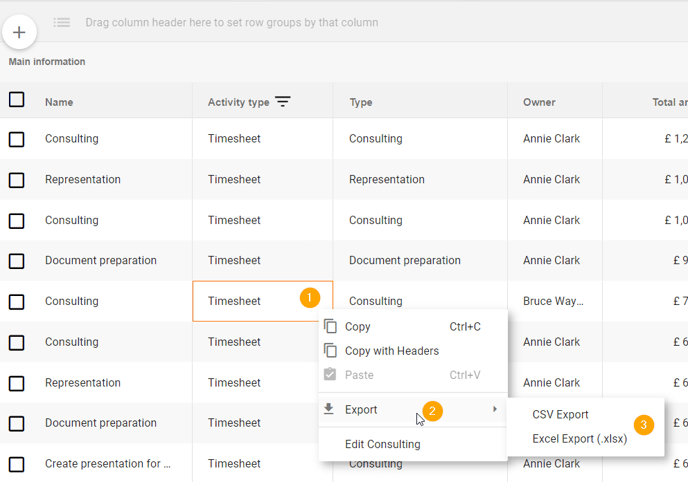
How To Export Report Data into Excel or CSV?
If you want to work with report data in a dedicated tool, such as a spreadsheet, you can always export table data as an Excel (.xls) or comma-separated values (.csv) file.
1. Click the right mouse key;
2. Select Export from the drop-down list menu;
3. Select the format Excel Format .xls or Comma Delimited .csv. Your exported report downloads.
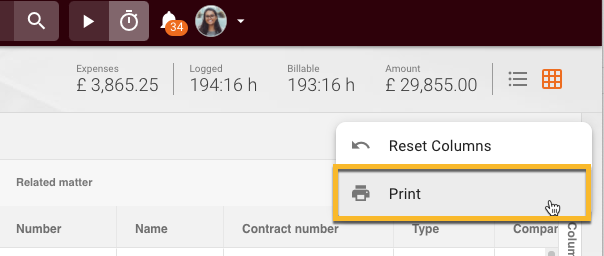
How To Print Report Data in Amberlo?
If you need to print a report data:
1. Configure the Report as needed;
2. Click on the three dots on the right side of the window:
3. Select Print:
We hope this will help you to start using it smoothly. If you have any questions or feedback, please feel free to contact us via support@amberlo.io. We are always happy to hear from you!